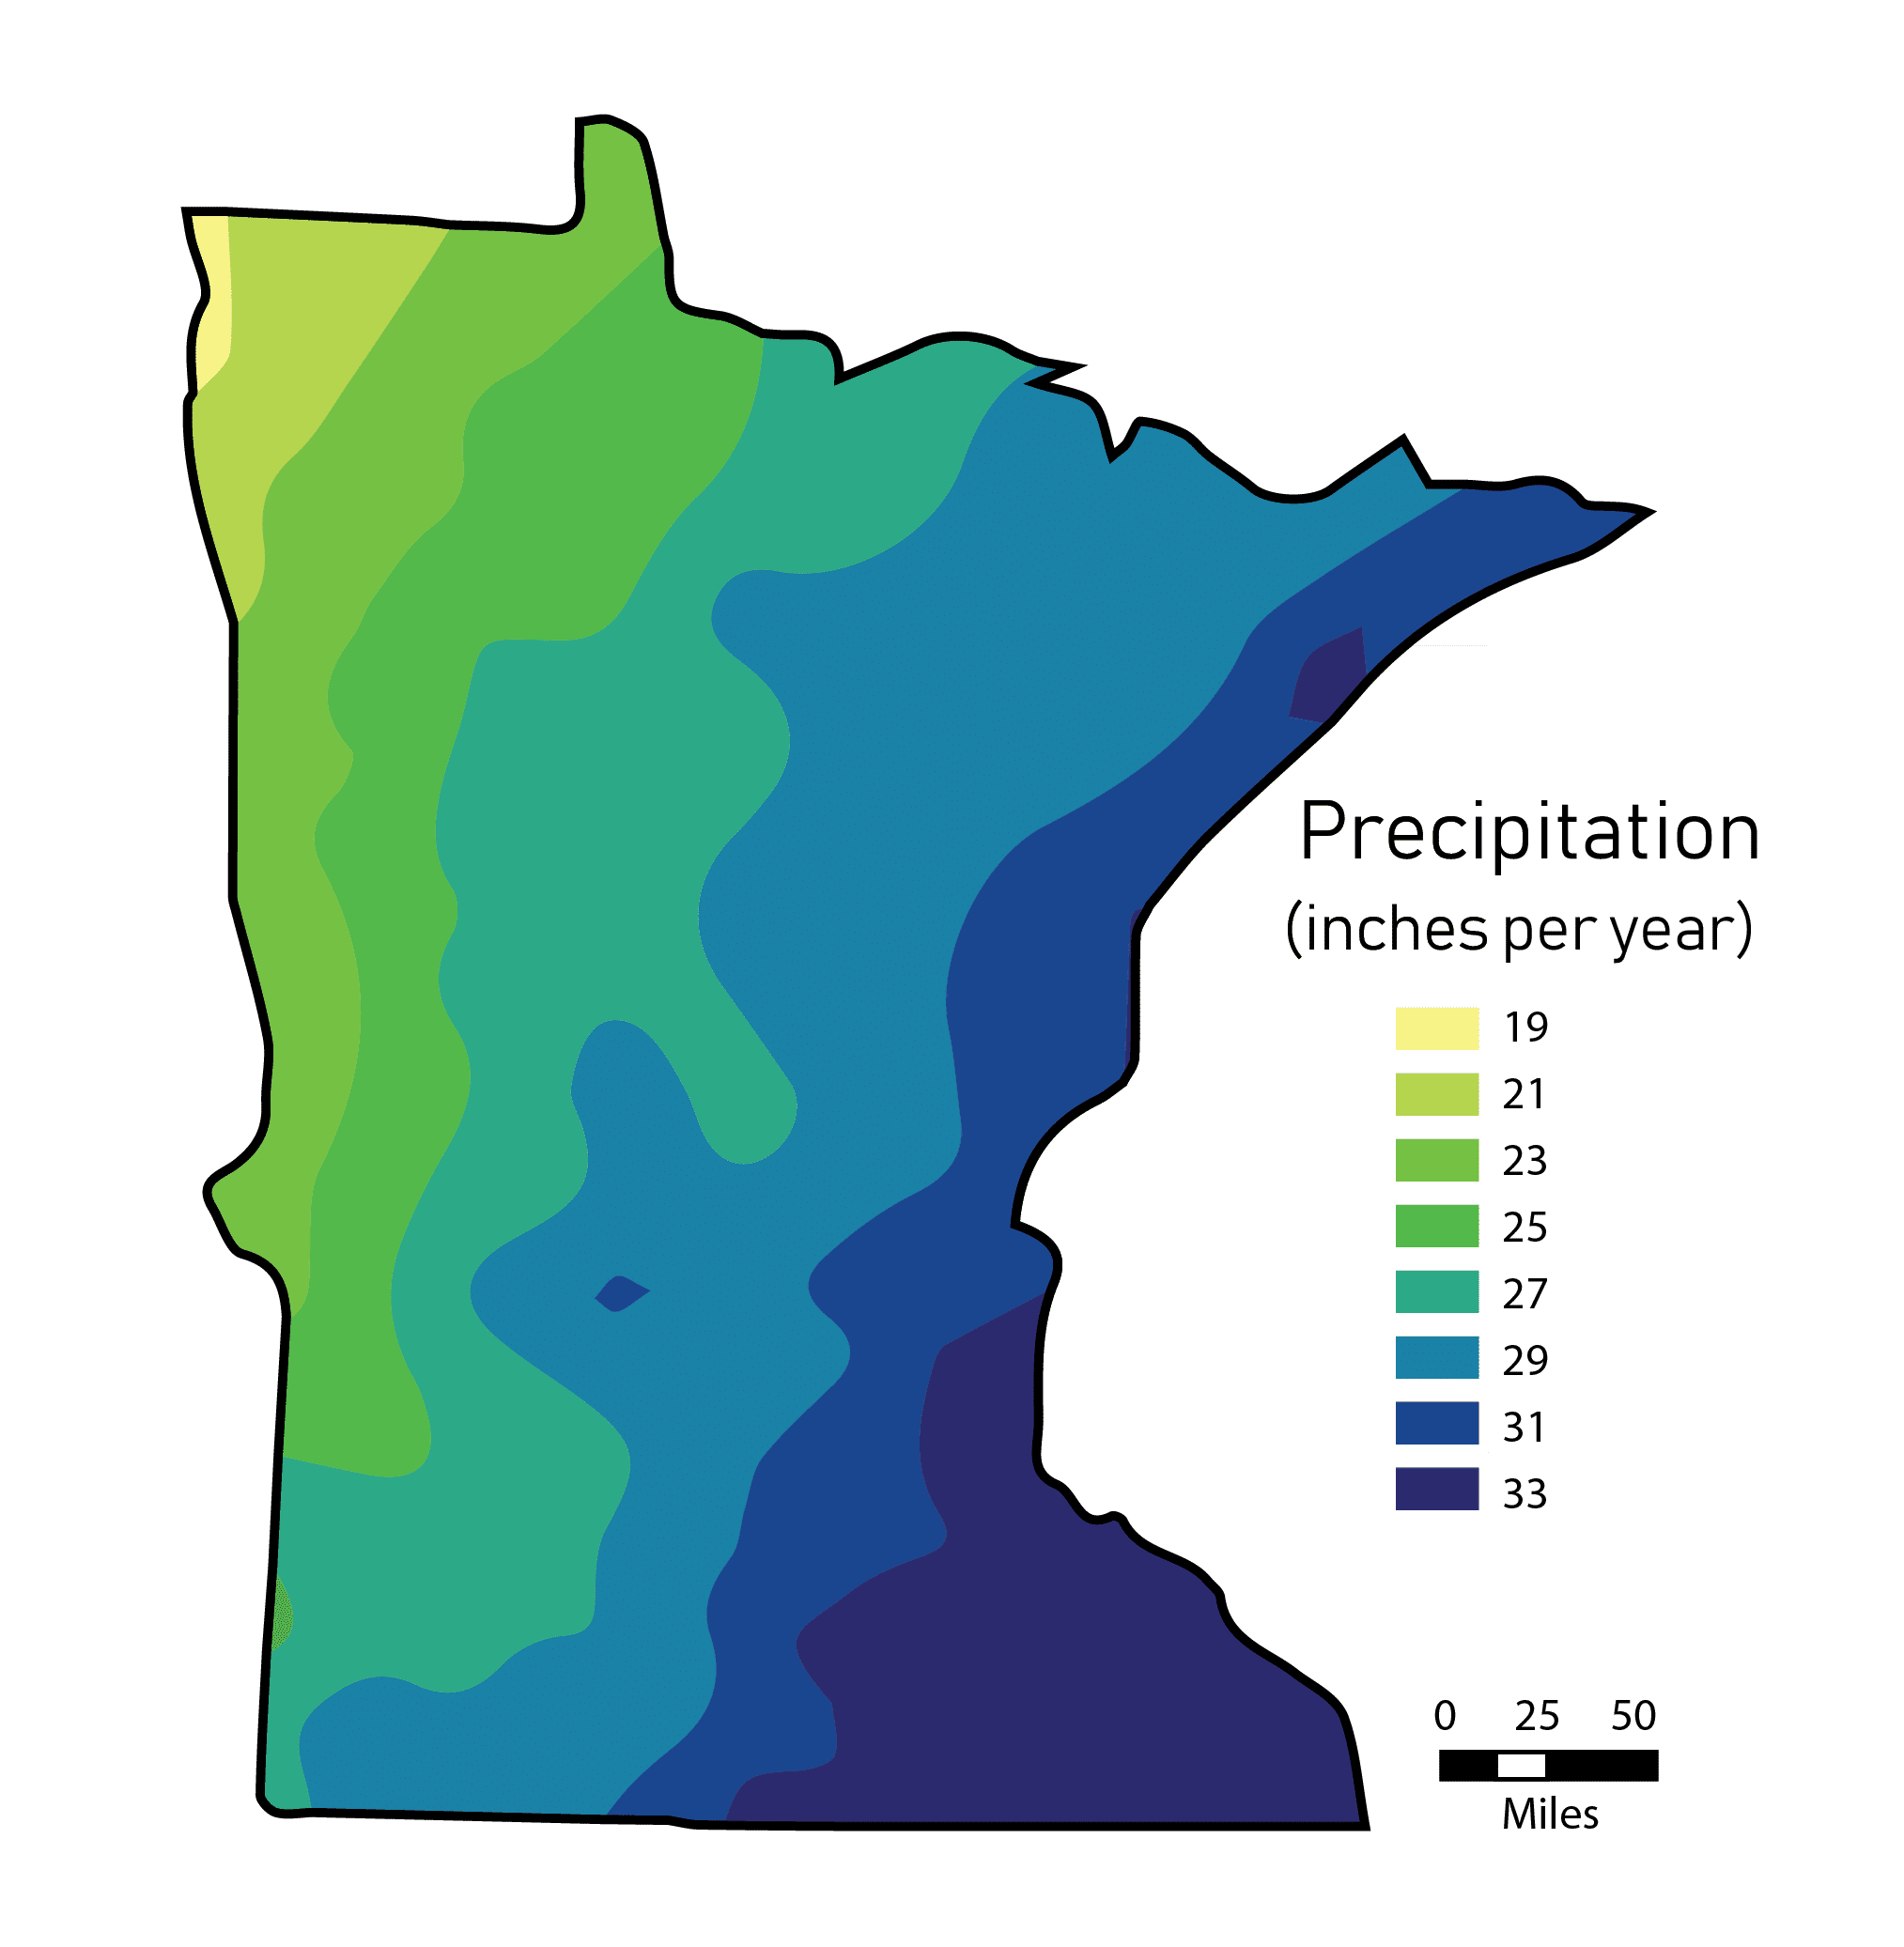
Minnesota Rainfall
Rainfall Map

19 inches of rain per year.
19 inches of rain per year.
21 inches of rain per year.
23 inches of rain per year.
25 inches of rain per year.
27 inches of rain per year.
29 inches of rain per year.
31 inches of rain per year.
33 inches of rain per year.
Data Source: National Weather Service, MN DNR, Soil & Water conservation Districts, and others; compiled by the MN DNR.

Ask Yourself
- Which growing areas normally get the least rainfall each year?
- Which areas get the most?
- Why must farmers understand rainfall patterns when they choose which crops to plant?
- What happens to farm crops when rainfall is way ABOVE normal?
- What if it is way BELOW normal?
